
Most executive dashboards are lying to leadership. Not intentionally. Not maliciously. But when your leadership team is reviewing a report that shows green across the board while projects are quietly slipping, resources are silently maxed out, and strategic priorities are slowly drifting off course, that dashboard is not informing decisions. It is obscuring them.
We see this in almost every organization that comes to TransformXperience for help. The dashboards exist. The reports go out every week. And leadership still cannot answer the questions that matter: Are we on track? Where are we exposed? Do we have the capacity to deliver what we just committed to? They are getting data. They are not getting visibility.
There is a difference, and that difference is costing you.
The Visibility Gap Is a Leadership Problem, Not a Technology Problem
Here is what we have learned after working with executive teams across healthcare, financial services, and mid-market organizations navigating digital transformation: the problem is almost never the tool. Organizations have reporting platforms, project management systems, and dashboards with reporting built in. They still do not have visibility.
The problem is that no one designed the dashboard for the person sitting in the leadership chair. Someone designed it for the person pulling the data. And those are two very different design briefs.
The executive asking whether the organization will hit its Q3 commitments does not need a detailed project timeline. The board member asking where the biggest risk exposure sits right now does not need a task completion percentage. And the chief operating officer who needs to make a resource trade-off decision by Friday does not have time to interpret a twelve-tab spreadsheet before the window closes.
When the dashboard does not answer the questions leadership is actually asking, one of three things happens. They stop trusting it. They stop using it. Or they keep using it and make decisions on incomplete information without realizing it. None of those outcomes are acceptable, and all three are more common than most organizations want to admit.
This is the visibility gap. And closing it requires a deliberate approach, not another tool purchase.
What Executives Actually Need to See
Before a single dashboard gets designed, the first question TransformXperience asks is this: what decisions does this dashboard need to support?
That question reframes everything. It moves the conversation from what data do we have to what does leadership need to act. And the answer, across every engagement we have run, comes down to three things.
Status means knowing where the organization stands against its commitments at a glance, not after interpretation. Overall portfolio health. What has moved since the last cycle. What is on track, what is at risk, and what needs a decision now. Color-coded indicators, trend lines, and variance summaries do this job. Dense task-level tables do not.
Risk means knowing what could derail the plan before it does, framed in business terms not technical ones. Leadership does not need a probability matrix. They need to know what the organization stands to lose, which risks have crossed a threshold that requires their involvement, and what decision is sitting on the table waiting for them. When risk is translated into business impact, it gets acted on. When it stays in a risk register, it gets ignored until it is too late.
Resource reality means knowing whether the organization actually has the capacity to deliver what it has committed to. This is the area where most dashboards fail most completely. Leadership approves initiatives. Teams execute them. But nobody shows the leadership team the cumulative load those approvals have created. When resource constraints are invisible at the top, the first sign something is wrong is a missed deadline, a quality issue, or a burned-out team. By then, the damage is already done.
Beyond these three, every metric needs context. A number without a trend is almost meaningless. A status without a benchmark cannot be evaluated. The dashboard must show where you are relative to where you planned to be, and where you are heading relative to where you need to go.
The Seven Metrics That Belong in Front of Leadership
One of the most consistent findings in our work with executive teams is that organizations are measuring the wrong things at the leadership level. They are reporting project-level metrics to portfolio-level decision makers. The mismatch creates noise, erodes trust in the reporting, and slows down the decisions that need to happen fast.
Here are the metrics that actually belong in front of the leadership team.
Portfolio health gives leadership an immediate read on overall execution. What percentage of active initiatives are on track, at risk, or off track, tracked as a trend over time. A portfolio moving from 80 percent on track to 60 percent on track is telling you something critical. Without the trend, you just see a number. With the trend, you see a problem developing in time to address it.
Strategic alignment answers the question most organizations are afraid to ask: how much of what we are executing is actually connected to this year’s priorities? In our experience, when organizations map their active portfolio to their stated strategy for the first time, they are rarely happy with what they find. A significant share of execution capacity is often pointed at work that predates the current strategic plan. This metric makes that visible and forces the conversation that can only happen at the leadership level.
Benefits realization closes the loop on investment. Most organizations track whether a project was delivered. Almost none track whether it delivered what it was supposed to. Benefits realization metrics hold the portfolio accountable to its original business case and give leadership the confidence to tell the board that investment is producing outcomes, not just activity.
Time to decision measures how long it takes from the point an issue is escalated to the point a decision is made. When this cycle is long, teams stop escalating because they do not believe the escalation path works. Problems get managed at lower levels than they should be, and leadership loses the visibility they need to govern effectively. Tracking this metric creates accountability at the top of the organization.
Resource utilization against capacity shows the ratio of demand to available delivery capacity. When this ratio exceeds roughly 80 percent, schedule slippage and quality degradation follow predictably. This is the metric that enables proactive trade-off decisions instead of reactive firefighting after a deadline is already missed.
Financial performance of the portfolio tracks how actual spend is tracking against approved budgets across all active initiatives. Budget variance at the portfolio level is a leading indicator of scope growth, execution problems, or both. Leadership needs to see it early enough to act, not in the post-mortem.
Risk exposure translates the technical risk register into the aggregate business exposure the organization is carrying right now. Not a list of risks with probability scores. A clear picture of total unmitigated exposure, with the highest-impact items surfaced for a decision.
How TransformXperience Builds Executive Dashboards
We do not hand clients a template and wish them well. We build executive visibility frameworks through a structured engagement that starts with the leadership team and works backward to the data.
The first thing we do is sit with the executives who will use the dashboard and ask them the questions most organizations skip entirely. What did you not know last quarter that you wish you had known? What decisions took longer than they should have? What are you still not confident you could answer if the board asked you tomorrow? Those answers define the dashboard. Everything else gets cut.
From there, we define the reporting cadence around the organization’s actual decision-making rhythm, not around what is easy to pull from the systems. We design for the sixty-second read, meaning every element on the screen has to earn its place by informing a decision or changing an action. If it does not do one of those two things, it does not belong there.
We build in the escalation path that most dashboards are missing entirely. The bridge between visibility and action. What is at risk, who owns the decision, and what is the deadline. Without that, a dashboard is just a status report.
And before it goes live, we validate it in a real leadership meeting. We use it to answer the questions that actually come up in that room. If it cannot do that, it is not ready. We have caught more dashboard design failures in that single session than in all the reviews that came before it.
The organizations that work with TransformXperience on executive visibility leave with something most of their peers do not have: a leadership team that trusts its data, moves faster on decisions, and can speak to the state of the portfolio with precision when it matters most.
The Mistakes That Undermine Visibility Before It Can Work
We have also seen what happens when organizations try to build executive dashboards without a structured approach. The same mistakes appear so consistently that we now recognize them as predictable failure patterns.
Building for the creator, not the consumer. A technically accurate dashboard that leadership does not trust or use is not a dashboard. It is a liability, because it creates the false impression that visibility exists when it does not. The fix is to involve leadership in the design process from the beginning, not as approvers at the end.
Reporting activity instead of outcomes. Forty-seven tasks completed last week is not information leadership can act on. An initiative moving from at risk to on track because three critical dependencies were resolved is. The shift from activity to outcome reporting is the highest-leverage improvement most organizations can make, and it almost never requires new technology.
Hiding bad news. Dashboards that consistently show healthy portfolios lose credibility fast. When leadership discovers the dashboard has been masking problems, they stop using it entirely. The organizations that build honest reporting into their visibility frameworks are the ones that catch problems early enough to fix them.
Treating the dashboard as a static deliverable. Executive dashboards built once and left unchanged become outdated within a quarter. Priorities shift. New initiatives come in. The questions leadership is asking evolve. Without a structured review cycle built in from the start, the dashboard that was relevant in January becomes noise by April.
The Cost of the Visibility Gap
Every week that your leadership team is operating without accurate, trusted executive visibility is a week where decisions are slower than they need to be, risks are escalating that no one at the top can see, and resources are being committed to work that may not be connected to the priorities that matter most.
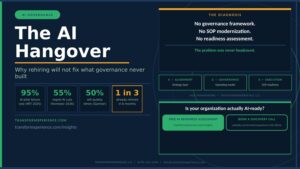
That is not a technology problem you can solve with a new platform subscription. It is a governance problem. And it compounds quietly until something breaks visibly: a missed deadline the board notices, a resource crisis that derails a key initiative, a strategic review that reveals the portfolio has been pointing in the wrong direction for months.
By the time those problems surface, the cost of the visibility gap has already been paid. The only question is whether you are going to keep paying it.
Your Next Step
TransformXperience has built executive visibility frameworks for leadership teams across healthcare, financial services, and technology organizations. We know what works, we know what fails, and we know how to build dashboards that leadership teams actually use to make faster, better decisions.
If your leadership team does not have the visibility it needs right now, that conversation starts with thirty minutes.
Download the Executive Dashboard Template at transformxperience.com/insights as a starting point for understanding what your current dashboard may be missing.
Then book a discovery call at calendly.com/transformxperience-info/30min. We will assess your current visibility framework, identify the gaps that are costing you the most, and show you exactly what a leadership-ready dashboard looks like for an organization at your stage.
The visibility gap is fixable. But it does not fix itself.