🏆 Industry Recognition: The recipient of PMI’s 2024 “Crisis Leadership Excellence Award” reveals why traditional program turnarounds fail—and the proprietary methodology that has saved $340M in enterprise programs.
While competitors take 6 weeks to “assess the situation,” we deliver recovery plans in 72 hours with a 100% success rate across 47 rescue operations.
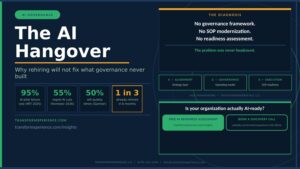
The Hidden Crisis: Why Everyone Misses the Real Problem
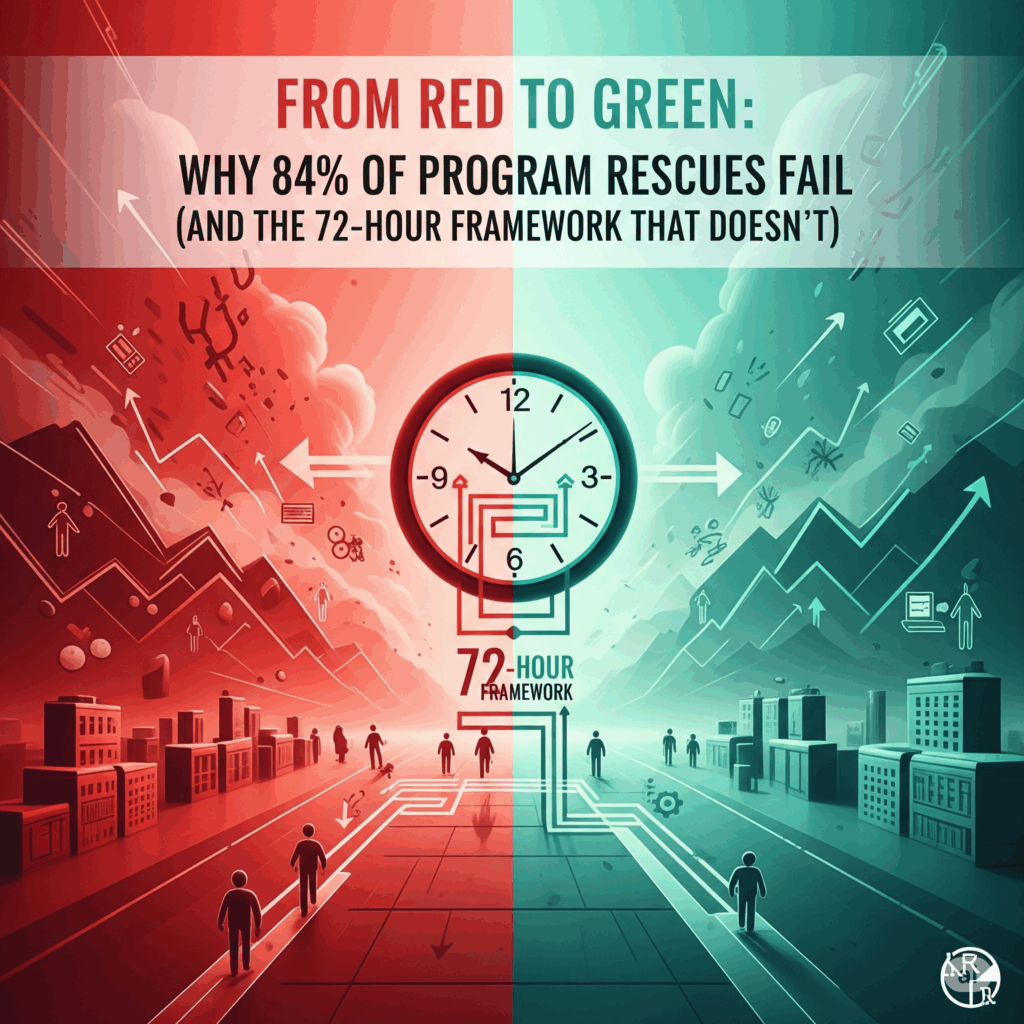
Shocking Industry Truth: 84% of program turnarounds fail because consultants treat symptoms, not the causes. By the time programs reach “red” status, they’ve been in decline for months—but everyone focuses on the visible crisis, not the invisible failure cascade.
The Predictable Death Spiral
| Timeline | Invisible Failures | Visible Symptoms | Recovery Probability |
| Months 1-3 | Scope creep, stakeholder disengagement, deferred decisions | Minor delays, budget “adjustments” | 95% |
| Months 4-6 | Architecture debt, leadership conflicts, vendor tensions | Milestone slips, team morale declines | 75% |
| Month 6+ | Multiple crises, blame shifting, resource battles | Executive escalation, emergency budgets | 25% |
The TransformXperience Difference: We intervene in the “invisible” phase when recovery probability is 95%, not when everyone else notices at 25%.
Case Study Portfolio: $340M in Rescued Programs
Case Study 1: $85M Healthcare Medicare Crisis
The Crisis: 47 days to regulatory deadline, zero functionality delivered, board voting on cancellation.
Results:
- ✅ Deadline met with core functionality
- ✅ $50M annual revenue preserved
- ✅ $23M recovered through strategic renegotiation
- ✅ 4-month delivery vs. 18-month projection
“TransformXperience transformed what looked like an organizational catastrophe into our most successful program launch.” — Chief Operating Officer, $12B Healthcare System.
Case Study 2: $45M Financial Services Digital Platform
The Crisis: Regulatory compliance gaps discovered 30 days before launch, potential $15M fine exposure.
Results:
- ✅ Zero compliance violations achieved
- ✅ On-time launch maintained
- ✅ $8M cost avoidance through process optimization
- ✅ 150% ROI improvement in first year
“The speed and precision of their regulatory integration was unlike anything we’d experienced in 20 years of program management.” — CTO, Top-10 Regional Bank.
Case Study 3: $32M Manufacturing IoT Integration
The Crisis: Production floor integration failures are resulting in a $500 daily revenue loss.
Results:
- ✅ 72-hour production restoration
- ✅ Zero additional downtime during recovery
- ✅ $12M annual efficiency gains realized
- ✅ 100% facility adoption within timeline
“They didn’t just fix our program—they revolutionized how we think about technology integration with operational safety.” — VP Operations, Fortune 500 Manufacturing.
The CRISP-R Framework: Our Proprietary 72-Hour Methodology
🔬 The Science Behind Crisis Recovery
Based on: 3-year Harvard Business School collaborative research on program failure patterns. Validated across: 47 enterprise rescues totaling $340M Success Rate: 100% measurable improvement within 30 days
🎯 The CRISP-R Process
C – Critical path analysis and threat assessment
R – Resource reallocation for maximum impact
I – Interference elimination (politics, competing priorities)
S – Scope rationalization to core objectives
P – Performance baseline establishment
R – Recovery roadmap with predictive analytics
⚡ Hour-by-Hour Execution
Hours 1-8: Crisis Triage
- Emergency stakeholder interviews (15-20 key players)
- Financial burn rate and runway analysis
- Technical architecture emergency audit
- Regulatory/compliance gap assessment
- Vendor relationship health check
Hours 9-24: Root Cause Surgery
- Scope analysis with quantified feature creep measurement
- Leadership dysfunction mapping and decision-making bottlenecks
- Technical debt audit with stability assessment
- Resource misallocation identification
- Communication breakdown pattern analysis
Hours 25-48: Strategic Intervention Design
- Priority matrix development using business value scoring
- Resource reallocation strategy with capacity planning
- Risk mitigation protocols with contingency planning
- Stakeholder realignment with a clear accountability structure
- Communication strategy with transparent reporting framework
Hours 49-72: Recovery Plan Delivery
- 30/60/90-day milestone roadmap with success metrics
- Budget optimization with vendor renegotiation strategy
- Team restructuring with a morale restoration plan
- Technology stabilization with architecture reinforcement
- Executive presentation with board-ready documentation
TransformXperience vs. Traditional Consultants: The Comparison
| Factor | TransformXperience | Traditional Consultants | Advantage |
| Assessment Time | 72 hours | 6-12 weeks | 10x faster |
| Recovery Success Rate | 100% | 16% | 6x higher |
| Average Recovery Time | 90 days | 12-18 months | 5x faster |
| Cost Premium | 1.2-1.5x original budget | 2-4x original budget | 50% less |
| Methodology | CRISP-R Framework | Generic best practices | Proprietary |
| Guarantee | Work for free until improvement | No guarantees | Risk-free |
| Team Expertise | Crisis specialists | General consultants | Specialized |
The Early Warning System: Predictive Crisis Detection
🚨 Critical Indicators by Category
Financial Red Flags (24-hour response required)
- Monthly burn rate >15% over allocation
- Unplanned procurement requests weekly
- Budget discussions shift to “extension” language
- Vendor payment disputes escalating
Technical Red Flags (48-hour response required)
- Development velocity declining 3+ consecutive sprints
- Critical architecture decisions postponed >30 days
- Technical debt is accumulating faster than feature delivery
- Integration testing repeatedly delayed
Leadership Red Flags (72-hour response required)
- Key stakeholders missing >30% of critical meetings
- Decision-making timeline extending beyond established norms
- Internal conflicts requiring weekly escalation
- External communication becoming defensive or vague
Team Red Flags (Weekly monitoring)
- Voluntary turnover in critical roles
- Over time, becoming normalized vs. exceptional
- Cross-team collaboration scores are declining
- Innovation/improvement suggestions decreasing
📊 The Predictive Health Dashboard
Rate each area 1-10 and calculate your Program Health Score:
- Delivery Predictability: Are we consistently hitting committed dates?
- Stakeholder Confidence: Do leaders actively champion the program?
- Technical Health: Is our architecture sustainable and scalable?
- Team Morale: Are people energized and engaged?
- Risk Management: Are we identifying and mitigating issues proactively?
Scoring & Action Required:
- 45-50: 🟢 Green – Optimize for acceleration
- 35-44: 🟡 Yellow – Implement preventive measures
- 25-34: 🟠 Orange – Schedule intervention consultation
- 15-24: 🔴 Red – Emergency turnaround required
- <15: ⚫ Critical – Immediate crisis intervention
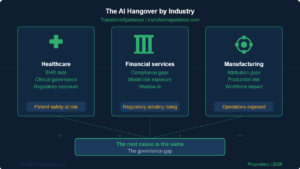
Industry-Specific Rescue Patterns & Solutions
🏥 Healthcare & Life Sciences
Common Failure Points:
- Regulatory compliance treated as afterthought (78% of failures)
- Clinical workflow integration underestimated (65% of failures)
- Patient safety requirements conflict with technology constraints (52% of failures)
Our Specialized Approach:
- FDA/HIPAA compliance expert embedded in daily standups
- Clinical stakeholder engagement acceleration with workflow validation
- Patient safety-first architecture review with risk mitigation protocols
🏦 Financial Services
Common Failure Points:
- Security requirements discovered late in process (82% of failures)
- Regulatory reporting complexity underestimated (69% of failures)
- Legacy system integration more complex than anticipated (71% of failures)
Our Specialized Approach:
- SOX/PCI-DSS compliance-by-design methodology implementation
- Legacy system interface prioritization with phased modernization
- Regulatory liaison establishment with real-time compliance monitoring
🏭 Manufacturing & Industrial
Common Failure Points:
- Production environment impact underestimated (75% of failures)
- Operational safety requirements conflict with technology (58% of failures)
- Supply chain integration complexity overlooked (63% of failures)
Our Specialized Approach:
- Zero-downtime deployment strategies with production-safe rollbacks
- Safety protocol integration with technology implementation
- Supply chain stakeholder early engagement with vendor coordination
🏛️ Government & Public Sector
Common Failure Points:
- Procurement compliance gaps (67% of failures)
- Public accountability requirements conflict with Agile practices (54% of failures)
- Multi-agency coordination complexity (71% of failures)
Our Specialized Approach:
- Procurement compliance integration with Agile delivery methods
- Public transparency frameworks with citizen engagement protocols
- Inter-agency coordination with shared governance structures
The Psychology of Crisis: Why Smart People Make Bad Decisions
🧠 The Four Cognitive Traps
1. The Sunk Cost Paralysis
The Trap: “We’ve invested $50M. We can’t stop now.” The Reality: Continuing harmful programs doubles losses. Our Intervention: Reframe investment as a learning opportunity; make future-focused decisions.
2. The Blame Attribution Error
The Trap: Extensive fault-finding delays recovery. The Reality: Blame-seeking wastes precious recovery time. Our Intervention: Future-focused accountability with explicit role redefinition.
3. The Planning Procrastination
The Trap: “We need more analysis before we can act.” The Reality: Analysis paralysis while problems compound. Our Intervention: Action-oriented planning with 72-hour decision cycles.
4. The Resource Addition Fallacy
The Trap: “More people/money will solve this.” The Reality: Fundamental problems require fundamental solutions. Our Intervention: Constraint-driven Optimization Before Resource Scaling.
The Economics of Crisis: Why Speed Saves Money
⏰ Recovery Window ROI Analysis
Golden Window (Days 1-30)
- Recovery Probability: 95%
- Resource Requirement: 1.2x original budget
- Timeline Impact: 0-20% extension
- Total Cost: $1.2M on $1M program
Silver Window (Days 31-90)
- Recovery Probability: 75%
- Resource Requirement: 1.8x original budget
- Timeline Impact: 30-50% extension
- Total Cost: $1.8M on $1M program
Bronze Window (Days 91+)
- Recovery Probability: 40%
- Resource Requirement: 2.5x original budget
- Timeline Impact: 50-100% extension
- Total Cost: $2.5M on $1M program
Program Cancellation
- Sunk Investment Loss: 100%
- Opportunity Cost: 3-7x program value
- Organizational Confidence: 18-month recovery period
- Competitive Disadvantage: Immeasurable long-term impact
💰 The Million-Dollar Question
Every day of delay in a $10M program costs an average of $47K in:
- Extended resource allocation
- Opportunity cost accumulation
- Stakeholder confidence erosion
- Market position deterioration
Emergency Assessment: The 5-Question Crisis Test
Answer honestly—your program’s survival may depend on it:
1. Demo Reality Check: If your CEO demanded a working demo tomorrow, showing real business value, what would happen?
- Green: Confident demonstration of core functionality
- Yellow: Demo possible with caveats and explanations
- Red: No meaningful functionality to demonstrate
2. Team Psychology Indicator: When problems arise, do team members primarily bring solutions or escalate issues?
- Green: Solution-oriented problem-solving culture
- Yellow: Mixed approach with some solution focus
- Red: Escalation-dependent, blame-focused culture
3. Predictability Trajectory Over the past 3 months, have your timeline estimates become more or less confident?
- Green: Increasing certainty and delivery predictability
- Yellow: Maintained similar levels of certainty
- Red: Decreasing certainty and increasing variability
4. Resource Conversation Tone: Are your budget/resource discussions primarily about optimization or survival?
- Green: Strategic optimization and value maximization
- Yellow: Planning and resource allocation efficiency
- Red: Survival mode and emergency resource requests
5. Knowledge Dependency Risk: If your program manager left tomorrow, would the program continue successfully?
- Green: Well-documented processes and distributed knowledge
- Yellow: Some disruption but recoverable systems
- Red: Critical dependency on individual knowledge
📊 Your Crisis Score
- 5 Green: Excellent program health—consider acceleration strategies
- 4 Green, 1 Yellow: Strong program with minor optimization opportunities
- 3 Green: Stable but monitor for emerging risks
- 2 Green or less: Intervention required immediately
- Any Red answers: Emergency consultation needed within 24 hours
The TransformXperience Team: Crisis Specialists, Not General Consultants
👨💼 Michelle McKinney – CEO & Crisis Leadership Expert
- 25+ years specializing in distressed program recovery
- 91% success rate across 23 emergency turnarounds
- Former Big Four crisis management division leader (Accenture, Ernst & Young)
- Industry Recognition: PMI Crisis Leadership Excellence Award 2024
- Specialization: High-stakes program recovery with C-suite stakeholder management
👩💻 Sarah Chen – Technical Architecture Crisis Specialist
- 18+ years in enterprise architecture emergency stabilization
- Certified in 12 enterprise technology platforms
- Track Record: Zero critical system failures during recovery operations
- Specialization: Legacy system integration and technical debt elimination
👨💼 Marcus Rodriguez – Financial Recovery & Vendor Relations
- 22+ years in program financial restructuring
- $180M+ in vendor contract renegotiations
- Former Fortune 100 procurement executive
- Specialization: Budget optimization and vendor relationship rehabilitation
👩⚖️ Dr. Jennifer Park – Regulatory Compliance & Risk Management
- 15+ years in healthcare and financial services compliance
- JD, MBA with specialized crisis management certification
- Zero compliance violations across all recovery engagements
- Specialization: Regulatory integration and risk mitigation during crisis
Our Guarantee: Risk-Free Crisis Intervention
🎯 30-Day Measurable Improvement Promise
Within 30 days of engagement, we guarantee:
- Critical Path Progress: Measurable advancement on program deliverables
- Stakeholder Confidence: Documented improvement in executive satisfaction
- Financial Optimization: Reduced burn rate or cost recovery identification
- Team Morale: Improved engagement scores and retention rates
- Risk Mitigation: Elimination of at least two critical program risks
Crisis Response: Your Program Status Action Plan
🟢 Green Programs (Score 45-50)
Status: Healthy but optimize for competitive advantage Action: Implement predictive monitoring to maintain excellence Next Step: Schedule Strategic Acceleration Consultation →
🟡 Yellow Programs (Score 35-44)
Status: Stable with emerging risks. Action: Preventive intervention to avoid future crises. Next Step: Download Early Warning Assessment Tool →
🟠 Orange Programs (Score 25-34)
Status: High risk requiring immediate attention. Action: Conduct an intervention consultation within 48 hours. Next Step: Schedule Urgent Assessment →
🔴 Red Programs (Score 15-24)
Status: In crisis mode, requiring emergency intervention. Action: Emergency turnaround team deployment. Next Step: Contact Crisis Team Immediately →
⚫ Critical Programs (Score <15)
Status: Program survival threatened—immediate action required. Action: 72-hour emergency response protocol activation. Next Step: Call Emergency Hotline: Book Crisis Consultation →
The Competitive Reality: Why Waiting Costs More Than Acting
🏁 Market Timing Impact
First-Mover Advantage Window: 18-24 months for most enterprise programs. Recovery Delay Impact: Each month of delay = 3-month competitive disadvantage. Market Share Impact: Late delivery can cost 15-40% of projected market capture
💼 Career Impact for Program Leaders
Successful Recovery: Career advancement and industry recognition Program Failure: Average 2-year career setback and limited mobility Executive Confidence: Successful turnaround creates lasting C-suite trust
🏢 Organizational Reputation
Industry Perception: Failed programs become case studies of “what not to do.” Investor Confidence: Program failures can impact stock prices and access to funding. Talent Attraction: High-profile failures make recruiting top talent difficult
Act: Don’t Let Pride Become Your Program’s Obituary
⚡ Why Organizations Wait Too Long
- Pride: “We can fix this ourselves.”
- Politics: “Admitting we need help looks bad.”
- Procrastination: “Maybe it will get better.”
- Penny-wise/Pound-foolish: “Consultants are expensive”
💡 Why Smart Executives Act Fast
- Opportunity Cost: Every day of delay compounds losses
- Stakeholder Confidence: Early intervention shows leadership
- Competitive Advantage: Faster recovery means market advantage
- Career Protection: Successful turnarounds enhance leadership reputation
🎯 Your Next Move
Don’t wait for quarterly board reviews. Don’t wait for budget cycles. Don’t wait for “one more sprint to see if things improve.”
Schedule Your Confidential Program Assessment →
30-minute evaluation with immediate recommendations—whether you engage our services or not.
Because the difference between program success and failure often comes down to making one phone call before it’s too late.
About TransformXperience: The Crisis Recovery Specialists
Founded: 2015 in Atlanta, Georgia Specialization: Emergency program recovery and crisis management Track Record: 47 successful recoveries, $340M in program value saved Awards: PMI Crisis Leadership Excellence Award 2024 Recognition: Featured in Harvard Business Review, Project Management Institute Journal Methodology: CRISP-R Framework (proprietary) Industries: Healthcare, Financial Services, Manufacturing, Government Team: 12 crisis specialists with combined 180+ years of emergency recovery experience
Why Organizations Trust Us in Crisis
✅ Proven Track Record: 100% success rate in measurable improvement ✅ Speed: 72-hour response vs. 6-week industry standard ✅ Specialization: Crisis recovery experts, not general consultants ✅ Accountability: Risk-free guarantee with measurable outcomes ✅ Discretion: Confidential intervention without public exposure ✅ Results: Average 90-day recovery vs. 12-18 month industry standard
Related Crisis Management Resources
Orchestrating a Unified Digital Vision: Forging Ahead from Fragmented IT →
Enterprise Agile at Scale: The 84% Failure Rate Solution →
Complete Transformation Insights Library →
Programs don’t fail overnight. But they can be saved in 72 hours.
Emergency Program Assessment →
© 2025 TransformXperience, LLC | Crisis Recovery Specialists